|
|
|

|
 |
Scott has really gone above and beyond by putting together these Frequently Asked Questions. Chris and I cannot thank him enough! The people we have trained in the past have so many and varied skills, we're very lucky to draw on their areas of expertise. So, if you haven't purchased Metastock yet, to suck every bit of juice out of the program, invest in your future. Here's what you need to do:
If you haven't bought Metastock already, get stuck into it! N.B. Metastock is a proprietary product of the Equis Corporation at this link.
|
Questions About Metastock
Read through these questions, then click on the one that you're interested in to read the answer.
1) Can I download Metastock instead of installing it from a CD?
2) Metastock keeps coming up with an error. How do I get it to run?
3) When I run Metastock it keeps asking for a license key. What does this mean?
4) How many computers can I load Metastock on?
5) How do I set up Trading Game data?
6) How do I get Metastock to find my charts?
7) How do I find the All Ordinaries Index?
8) I am supposed to get World Indices. How do I find them?
9) How do I get my charts to open with all my settings every time?
10) What do I really have to know about Metastock for the Mentor Program?
11) What are custom folders and why use them?
12) How do I set up custom folders?
13) What is the difference between custom folders, layouts and favorites?
14) How do I store my current portfolio or watch list?
17) How do I save charts in favorites?
18) Can I do backtesting in Metastock?
19) Does Metastock have a portfolio manager?
20) How do I create an expert?
21) How do I delete smart charts?
22) How do I view all of the ASX 200 charts in MetaStock?
23) How do I set up Louise’s candles in Metastock?
24) How do I view data values on my chart?
25) Should I run the Update Symbols Database or run the Downloader?
26) What do the numbers on the main window mean?
28) Backing up Metastock indicators, experts, and explorations
30) Creating a favorites folder
31) Why doesn’t my chart open in a weekly timeframe as I have set out in my default template?
32) How do I get a chart up on the forum?
33) What's the best option for keeping a backup of the Trading Game data for Metastock?
34) Should I upgrade to the next latest & greatest version of Metastock?
35) What about if I feel I need one-on-one Metastock training?
36) How do I draw trendlines at exact prices in Metastock?
37) What is the Rad*Chandelier Trailing stop, and can I use a few different modifications?
The Solutions
1) Can I download Metastock instead of installing it from a CD?
Equis, the company that produces Metastock, do have a downloadable version and you will need to contact them on the web support option either via live chat or email to get the details. Click here to read more.
![]()
2) Metastock keeps coming up with an error. How do I get it to run?
Metastock (after version 10.0), requires the software to be registered before you can use it. The registration details should be provided to you when you purchase the software.
In the event that you have not been given the registration key / license number to run the program, you will need to contact the supplier you purchased the program from and request these details.
Your copy of Metastock can be installed on two machines, however in the event that you replace a computer the license key needs to be uninstalled on the old machine and reinstalled on the new computer.
In the event of a complete computer melt down such that you cannot remove the license key to re-install elsewhere, you will need to contact your supplier of the original software to have a new license number re-issued.
![]()
3) When I run Metastock it keeps asking for a license key. What does this mean?
See the answer to “Metastock keeps coming up with an error. How do I get it to run?”
![]()
4) How many computers can I load Metastock on?
Your copy of Metastock can be installed on two machines, however in the event that you replace a computer the license key needs to be uninstalled on the old machine and reinstalled on the new computer.
In the event of a complete computer melt down such that you cannot remove the license key to re-install elsewhere, you will need to contact your supplier of the original software to have a new license re-issued.
![]()
5) How do I set up Trading Game data?
This is the link to answer most questions relating to setting up your trading game data.
This link provides you with a powerpoint show with step by step instructions on how to set up your trading game data, custom folders and how to point Metstock to look in the custom Folders.
This link is a link to a powerpoint viewer for those that Do Not own a copy of Powerpoint. This will allow you to view the above presentation without having to buy the software.
![]()
6) How do I get Metastock to find my charts?
This link provides you with a powerpoint show with step by step instructions on how to set up your trading game data, custom folders and how to point Metstock to look in the custom Folders.
Click on this link to go to a microsoft website where you can download a powerpoint viewer for those who don't own a copy of Powerpoint. This will allow you to view the above presentation without having to buy the software.
![]()
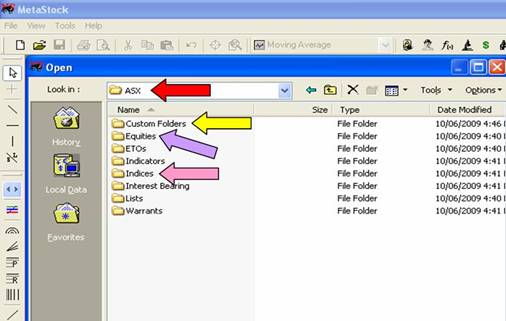
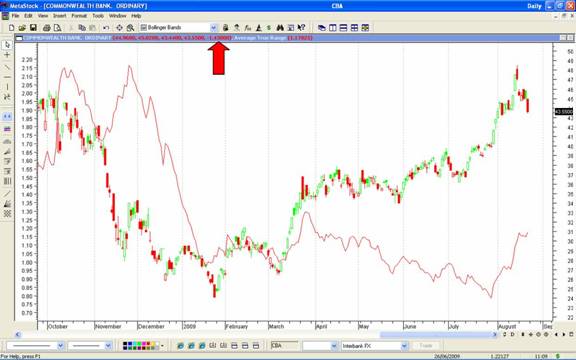
7) How do I find the All Ordinaries Index?
All the Australian and world indices are accessed from within Metastock although in different folders.
To access any of the Australian Indices you need to open the ASX folder (Red Arrow) then open up the Indices folder (Pink Arrow).
![]()
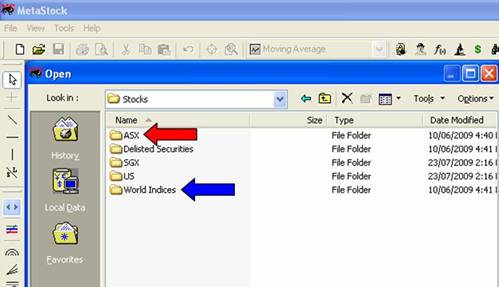
8) I am supposed to get World Indices. How do I find them?
World Indices are located in the World Indices Folder (Blue Arrow)
Equities can be located in the Equities folder (Purple Arrow) or custom folders folder (Yellow Arrow) under ASX (Red Arrow)
![]()
9) How do I get my charts to open with all my settings every time?
Metastock allows you to save your main settings so that they appear on your charts every time you open them up. The function that allows you to do this in Metastock is called a Template.
Metastock allows you to save a number of different templates with different settings. The primary template that will load when you open new charts is called the Default Template.
The following picture shows how to add indicators and experts then save the design as your Default Template.
- Add indicators (Red Arrow)
- Add an Expert (Yellow Arrow)
- Save as Default Template (Green Arrow)
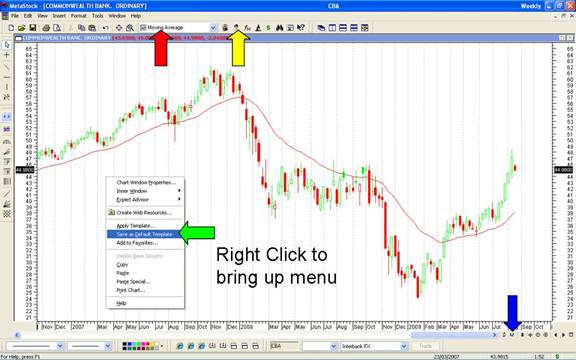
The template will not work on previously opened and saved charts so you can either delete all smart charts (link) or use the “Apply Template” option just above the Save as Default Open shown by the green arrow to apply your favourite Template.
![]()
10) What do I really have to know about Metastock for the Mentor Program?
Metastock is a charting package that is light on for visual effects but heavy on flexibility to create your own indicators, experts and explorations.
'Experts' are a way of combining certain conditions on a stock, and visually displaying those conditions on a chart.
Explorations are a way of scanning multiple stocks for certain conditions and alerting the user to which stocks match the criteria set out.
So in summary 'must have' knowledge is:
- Add & remove indicators from a chart
- Set up a default template
- Understand the basics of how experts work
- Understand the basics of how the explorer works
'Nice to have' knowledge:
- Set up and save a layout
- Save files in a favorites Folder
- Delete Smart charts
![]()
11) What are custom folders and why use them?
Custom folders store standard groups of stocks, commonly the constituents of indices but may be a specific group of non standard stocks that many people would like to access. For example the share market game run by the ASX uses 100 stocks that are not a standard index but many people would like to see them located in one spot.
The key advantage of custom folders is that they are automatically maintained for you. This is of particular interest when looking at indices and their component stocks, because they are reviewed every quarter and changes are made with stocks added and deleted depending upon meeting the criteria for inclusion.
If you did not have custom folders then you would need to maintain a list buy identifying the changes announced by Standard & Poors, and making adjustments yourself.
![]()
12) How do I set up custom folders?
See “How do I set up Trading Game Data?”
![]()
13) What is the difference between custom folders, layouts and favorites?
Regardless of where you store the files i.e. custom folders, favourites, or layouts the price data will be updated always, as you do your data download.
If you save the contents of a custom folder as a favorites folder (effectively duplicating the custom folder) the actual constituents in the custom folder will change over time, however they won't in the favorites folder making this a dangerous endeavour. ie there is no benefit to do this.
Custom folders store standard groups of stocks, commonly the constituents on indices that are automatically maintained for you.
Both layouts and favorites are good for storing miscellaneous groups of stocks that may be an existing portfolio, watchlist etc.
Layouts are good to view a small group of stocks particularly portfolios. When you no longer own the stock you can delete it from the layout and add any new stocks as appropriate. It is important to note that you cannot do an exploration on a layout.
Favorites can be used to create a list of stocks for doing explorations on, which is not a standard Index (i.e. optionable US stocks in a particular watchlist ). You cannot do explorations with a layout.
So in Summary:
Use layouts for your portfolio or watchlists that you can quickly open and view. This should cover your current needs.
If you have saved them in favorites then this is fine also, because you can have a play and see what the differences are to layouts.
Do not save custom folder contents as either layouts or favorites, as there is no advantage and many disadvantages to doing this.
![]()
14) How do I store my current portfolio or watch list?
Layouts are good to view a small group of stocks particularly portfolios, when you no longer own the stock you can delete it from the layout and add any new stocks as appropriate.
![]()
15) Layouts or favorites?
See “What is the difference between custom folders, layouts and favorites?”
![]()
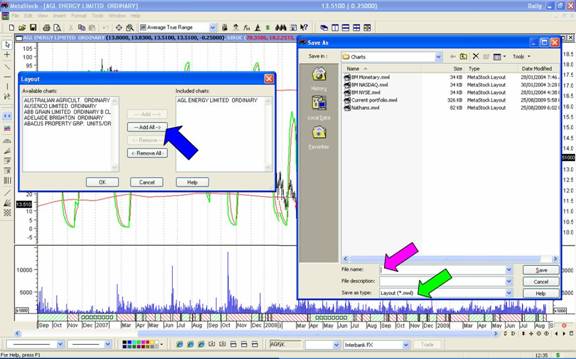
16) How do I create a layout?
The first step in creating a layout is to open the stocks you want to include in the layout. You can use your Shift or Ctrl key to select multiple stocks to open at the one time. (Red Arrow).
Once all of the stocks charts are open you can save them as a layout by selecting New, then Layout. (Yellow Arrow)
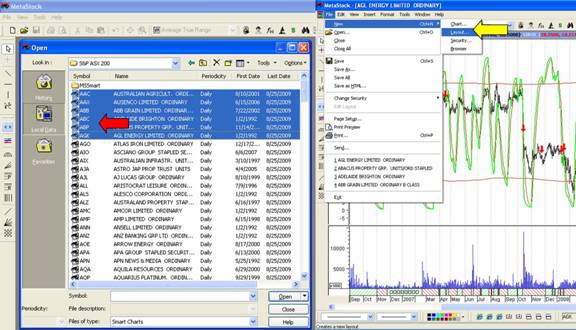
You will then be asked to select which stocks you wish to add to the Layout. If you have opened all of the charts in the first place then all you need to do is select Add All. (Blue Arrow).
Next step is to enter a Layout Name (Pink Arrow). Ensure that the Save as Type is set to layout. (Green Arrow)
![]()
17) How do I save charts in favorites?
Saving charts into a favorites folder is a relatively simple affair. There are a couple of main ways, the first adding bulk charts and the second adding one stock at a time.
To add multiple charts into a favourites folder you need to be at the open charts option.
- Select the charts you want to add to the favourites.
- Select Tools – Add to favorites
- Either create a new favorites folder or save to an existing favorites folder.
Also from any chart you can right click and add a chart to favorites
![]()
18) Can I do backtesting in Metastock?
They are run in the Enhanced System Tester under the green "$" symbol between the microscope and binoculars.
Generally speaking 3rd party add-ons are the preferred mechanism for system backtesting.
It should be pointed out that system backtesting has some drawbacks particularly early in the Mentor Program.
- These 3rd party backtesters usually require some sort of programming skill to get right and can be quite a bit of work.
- People get caught up in testing to the detriment of all else, including the lessons you need to learn in this program
- Its too easy to get caught up tinkering with your system
- You can get caught up back testing and not trading because you are looking for the perfect system.
- New traders with no idea can very easily get lost and lose the message the Mentor Program is trying to teach.
![]()
19) Does Metastock have a portfolio manager?
The Portfolio management function does not exist in Metastock as such you need to keep external records. This can be achieved by building your own in some form of spreadsheet or using a third party product.
The one that is quite cheap and pretty good is http://www.tradetrakker.com. Well worth investigating.
We've also tested out Stator (http://www.stator-afm.com/).
![]()
20) How do I create an expert?
This is best demonstrated with an example. A good example of a simple expert is applying Louise’s candlestick colouring.
https://store.tradinggame.com.au/webpages/12_trading.php#7HowdoIgetredgreencandlesinMetastock
![]()
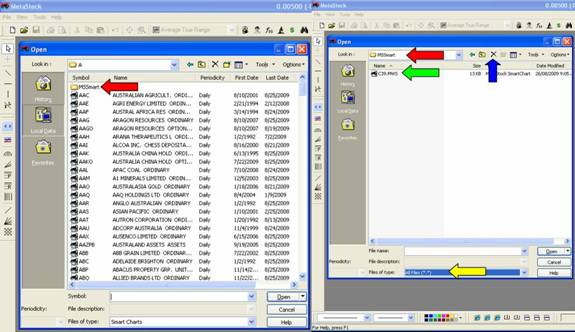
21) How do I delete smart charts?
Normally deleting things can result in an unwanted outcome however there are two areas where this can be useful. One is deleting some of the history charts so that the history folder doesn’t become so large as to be useless. The other is to delete the contents of the smart charts folders.
When you save a chart in Metastock it is saved in a separate folder called MSSmart, under each location that you opened the original chart.
E.g.
ASX/Custom Folders/S&P ASX 200/MSSmart or
ASX/Equities/A/MSSmart
These MSSmart folders do not appear until a chart is opened and saved and can appear everywhere charts are accessed from.
This is a useful tool as this saves all of your settings for that chart so that next time you open that chart it is the same as when you last opened it.
This can also become annoying when you want to have every chart open with a new default template because saved charts will look like they did when they were last saved, not how you want them to appear with the new template.
So you can either delete the contents of these folders one by one from within Metastock. This is ok if all of your smart charts are located in one spot, such as a custom folder. Be careful you are deleting smart charts only.
First open the folder where MSSmart folders are located (Red Arrow) and change the files of Type to All Files (Yellow Arrow). Highlight the smart charts designated by the file extension .MWS (Green Arrow). Then Delete (Blue Arrow)
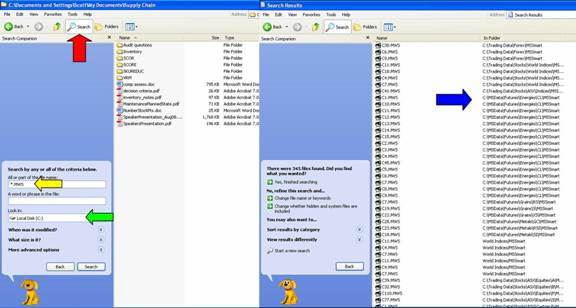
If you have smart charts stored in lots of folders then the fastest way is to do this using My Computer or Windows Explorer, outside of Metastock.
Open Windows Explorer and select Search (Red Arrow), type in to search for file types *.MWS (Yellow Arrow). The example shows a search on C drive (Green Arrow) you could narrow this search down and speed up the process by locating the “Trading Data” Directory.
Hit Search button and all of the smart charts will be found (Blue Arrow). Highlight all of the files and hit the delete button on your computer.
![]()
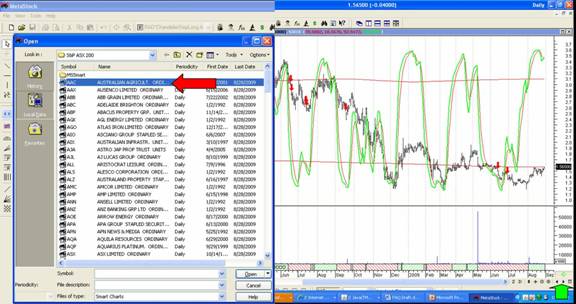
22) How do I view all of the ASX 200 charts in MetaStock?
Start MetaStock. In the Open dialog, open the folder that has the shares of the ASX 200. Select the first share on the list and open (Red Arrow). Now use the arrows at the bottom of the screen to move to the next stock in the list. (Green Arrow)
![]()
23) How do I set up Louise’s candles in Metastock?
The following instructions show you how to set up red and green candles for your charts.
In MetaStock, the Candlestick charts show the candles as black and white by default. The Up candles, where the close is greater than the open are coloured white and the Down candles, where the close is less than or equal to the open are coloured black.
Now whilst this is quite acceptable, there is also a general pseudo ‘standard’ that has Up days green and Down days red.
In MetaStock there is some colour selection available through the price plot properties box, but the colour relationship is based solely on the closing price i.e. the Up and Down colour selections apply to the closing price only, from one period to the next. So for example, if you set the colours as Green for Up and Red for Down, you might be surprised at the result.
You actually end up with FOUR different types of candles – and you only wanted TWO!
These are the possibilities:
1. An Open Green candle – the Close is above the Open and the Close today is higher than yesterday's Close
2. An Open Red candle – the Close is above the Open but the Close today is lower than yesterday's Close
3. A Solid Green candle – the Close is below the Open but the Close today is above yesterday's Close
4. A Solid Red candle – the Close is below the Open and the Close today is below yesterday's Close
So in this case:
‘A’ - the Candle is coloured Red or Green depending on the relationship of today's Close with yesterday's Close. If the Close is higher, then the Candle is Green, if the Close is lower, then the Candle is Red.
AND
‘B’ - the Candle is Solid if the Close is below the Open and Open (unfilled) if the Close is above the Open.
All clear - well I hope so!
Anyway, this is different to the way we really want our Candlesticks coloured. Normally, we only want to know if the Close is above or below the Open (part ‘B’ above).
Well the good news is that there is a way to get MetaStock to emulate this much sort after colour scheme using the ‘Expert Advisor’. We won’t be going into any detail about the Experts, except to give you a step-by-step guide to program this Candlestick colouring example.
1. Click on the Expert Advisor icon (the little man who looks like Charlie Chaplin!)

Or select the ‘Expert Advisor…’ from the ‘Tools’ drop down menu
You are now at the main Expert Advisor window.
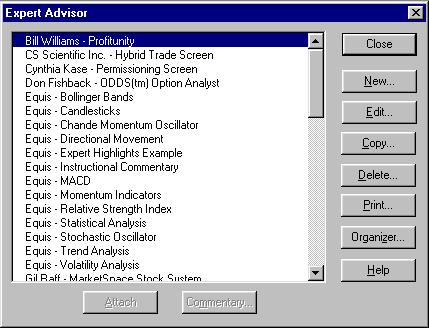
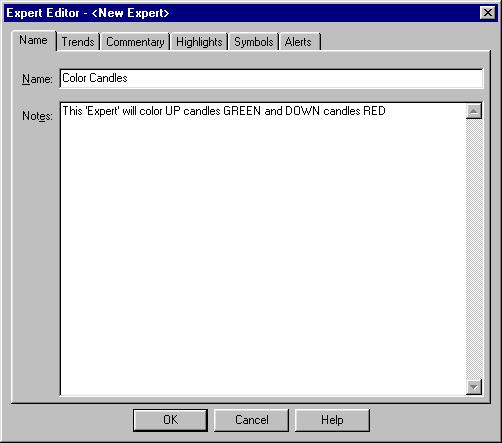
2. To create our new expert, click the ‘New…’ button.
This brings up the Expert Editor. Here you can give the Expert a name, something like ‘Candlestick Colours’ and also add some comments so you know what it does. Like this:
3. Now select the ‘Highlights’ Tab
Select ‘New’ to create a new highlight!
Complete the details as per the following:
You can use whatever colour you want – I selected Dark Green.
Please note that the O is an O as in Open!!
Click ‘OK’.
You are now ready to enter the second highlight (for Down candles – the unhappy ones!!!)
4. Click ‘New’ and complete the second highlight as follows, again you can use any colour you like:
Please note that the O is an O as in Open!!
5. To finish again, click ‘OK’.
You should now have something that looks like this:
6. Click ‘OK’ to return to the main Expert Advisor window.
Create a new chart or open and existing chart or Smart Chart, Right Click on the main chart window to bring up the right click short cut menu. From here select ‘Expert Advisor’ and then ‘Attach…’. This brings up the ‘Attach Expert’ box – select the Candle colouring expert or whatever you called the Expert and click the ‘OK’ button.
Your chart will then be coloured, Green bars or open candles where the Close is above the Open and Red bars or solid candles for when the Close is below the Open – make sure your chart is set to the Candlestick variety to get the best effect.
If you attach the Expert to a Smart Chart, then it will be saved with the Smart Chart, so each time you look at it, the candles will be nicely coloured. If you attach the Expert to a chart, you will be prompted to save the changes.
Experts can be included in templates too, so you might create a template that changes a chart to a weekly candlestick chart, colours the candles with the Expert and plots a 30 period exponential moving average.
To detach an Expert, right click on the main chart Window and select ‘Detach’ from the ‘Expert Advisor’ menu.
![]()
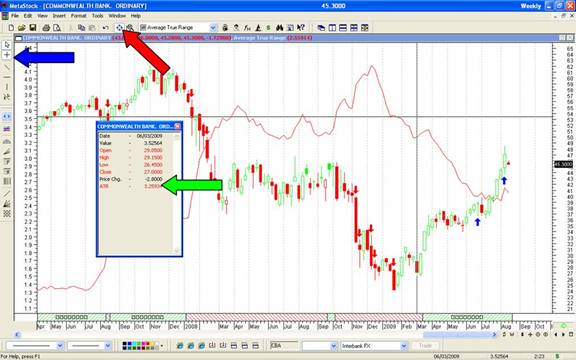
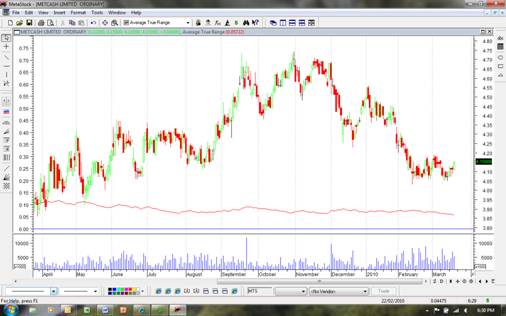
24) How do I view data values on my chart?
The easiest and most visible way is to select the cross hairs (blue Arrow) and the Data window (Red Arrow) as this allows you to see date ATR and price action all in one spot.
You can always just use the cross hairs by itself and hold your mouse over the ATR line where you want to get the past ATR result. I like to use the cross hairs so that I can line up the date and the ATR value so you don’t accidentally select incorrect data.
![]()
25) Should I run the Update Symbols Database or run the Downloader?
If you are using Trading Game data, you should not need to update the Symbol Database or use the Downloader as this is all handled in the Trading Game Data download module separate to Metastock.
If your data provider is compatible with the symbol database and Downloader then it should specify this in their user manual.
![]()
26) What do the numbers on the main window mean?
The red arrow is pointing to the most recent bars price data Open High Low Close and the negative number is the change from this close from the last close. in this case CBA closed down $1.43 from yesterdays close.
![]()
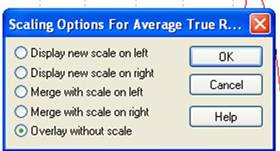
27) When I add an indicator it asks about scale. What does this mean? Also, can I have the Metastock Formula Primer?
Basically scales are used to allow very different price data to be seen on the same chart, and are broken into three broad categories. These are New Scale, Merge Scale, and Overlay.
The New scale on the left allows an overlay of an indicator that has small values to be seen in comparison to something that has much larger numbers. For example ATR is often quite small compared to the overall price and if you did not have different scales all you would see is a very small line across the bottom of the price chart.
Merge with scale on the right, which is normally where the price data of the chart is displayed. This is suitable for moving averages, or trailing stop losses as they are often directly comparable to the price data and will not be lost on the chart.
What is important is that things like two moving averages need to be in the same scale otherwise you will get inaccurate cross points.
Overlay without scale is used if you are only concerned about comparing relative movements between different plots:
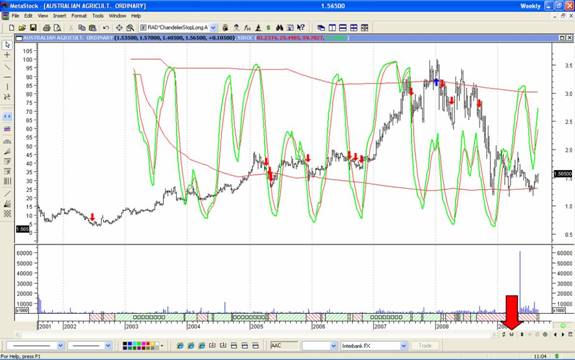
An example of a problem where an indicator has been scaled to the left, instead of the right.
In this example the Rad*Chandelier trailing stop can be seen to run right through the price data. Obviously not correct.
We can see the value of the trailing stop in the menu bar is less than the price so we know the indicator is not displaying correctly.
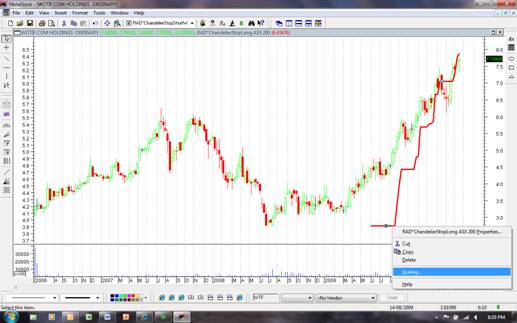
So using our mouse pointer over the indicator we want to re-scale, we right click and select scaling…
We then select the option “Merge with Scale on the right” and we get the following:
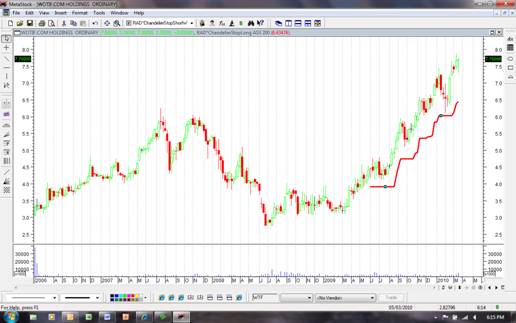
An example of where it makes sense to create a new scale on the left.
In this example we can see that the addition of the ATR(14) in the main window has squashed the price data up so its difficult to work out what’s going on with either the price data or the ATR.

So if we select display new scale on the left we adjust the picture to the following.
We can always then adjust the scaling on the left to make the ATR smaller or larger in the window.
Metastock Formula Primer
To download the Metastock Formula Primer (which is a manual that will show you how to write Metastock formulae), click here.
![]()
28) Backing up Metastock indicators, experts, and explorations
The critical thing to recognise is that short of having a mirror image of your drive, this is the only way you can back up your experts, indicators and exploration codes.
![]()
29) Copying trendlines
If you select the first trendline and right click on it - you can select copy or create parallel line.
Once you have pasted the new line or created the parallel line - you can move it around and adjust it as much as you like by selecting the line and moving one of the boxes at the end of the trend line to change the angle.
![]()
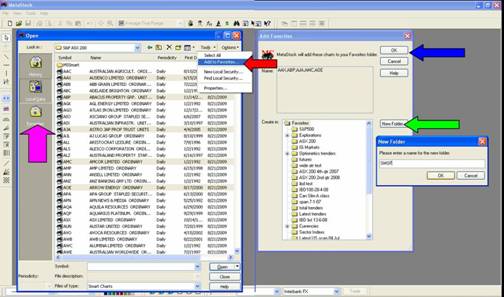
30) Creating a Favourites folder
Here is how you create, add and access stocks in a favorites folder.
First go to open a stock from either your custom folders or the ASX Equities A,B,C etc folders
Select the stocks you want to add by Holding down the shift or Ctrl Keys while selecting
Under the tools menu select the add to favourites option (Red Arrow)
Create a new favorites Folder (Green Arrow)
Select ok (Blue Arrow)
To access these in future select favourites instead of local data (Pink Arrow)
![]()
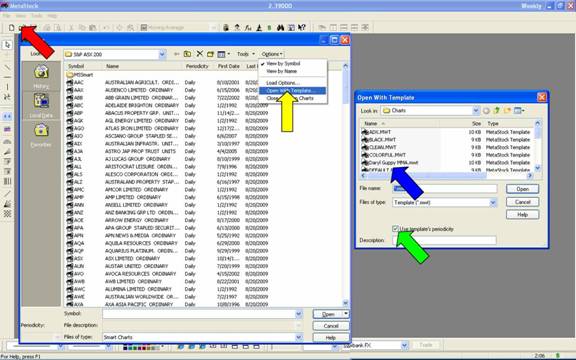
31) Why doesn’t my chart open in a weekly timeframe as I have set out in my default template?
Metastock primarily loads the data into a chart in the timeframe it is stored in and the default for this is daily so there is no way to short cut this aspect.
(This occasionally causes confusion when you run a weekly scan, open the charts and wonder why the scan picked that particular stock only to then realise its still in daily view.)
To overcome the periodicity issue if you open the chart then change the periodicity to weekly and press save. Next time you open the chart it will open with all your settings saved including a weekly timeframe.
You have the choice of just changing the periodicity (Red Arrow) because once its saved it will stay that way. Or hold Shift and roll your mouse scroll wheel.
Or the second option is to open the chart using the templates Periodicity which is a little more work. How to do that is the second picture attached. This allows you to have different templates setup for daily and weekly setups.
After a while you will find that you have opened so many charts and saved them as weekly that this poses less and less of a problem.
- At the open charts Menu (Red Arrow)
- Select Open with Template (Yellow Arrow)
- Select the Template (Blue Arrow)
- Select the Option to use the templates Periodicity (Green Arrow)
![]()
32) How do I get a chart up on the forum?
To first of all capture a chart from Metastock, ready to post onto the forum, open the chart in Metastock, and click on 'PrtScn' on your keyboard (which means Print Screen), then and paste the chart into Powerpoint. To paste it, you can either click on 'Ctrl' and 'v' simultaneously on your keyboard, or using the Powerpoint menu, click on 'paste'. From there I have the option to save as picture (I can also edit it) and I save it as a Jpeg file to my desktop.
Once saved I open it with Paint and downsized the image. To access the 'Paint' program that comes resident on most computers, click on the 'start' button on the bottom left hand side of your computer screen, then 'all programs', then 'accessories' and then click on 'paint'. You can open up jpg files or other images in there and annotate them quite easily.
If you don't have Powerpoint you can always paste it in a word document, but you don't have the option to save it as a picture, however you can just load the word document with the picture in it, onto the forum.
Now... to upload it to the forum -
First you need to select the upload attachment Tab (Red Arrow)
Then Browse to find your file (Green Arrow)
Then Add the File (Blue Arrow) This will take a while.

![]()
33) What's the best option for keeping a backup of the Trading Game data for Metastock?
Within trading game data downloader, there is a tab titled "Maintenance". This allows you to back up your data to a USB, external hard drive etc. The other important thing is being able to back up your experts and explorers within Metatstock. This is covered in 'Backing up Metastock indicators, experts, and explorations'. A simple backup up of your "C" drive will not back up these components.
These directions allow you to back up your critical data if you don't have a mirror of your hard drive.
![]()
34) Should I upgrade to the next latest & greatest version of Metastock?
No - it's just not necessary. Some very successful individuals who have completed the Mentor Program and are not full-time traders haven't upgraded since Version 7.2! It sometimes opens up a can of worms as weird bugs can mean that the upgrade will create problems for you in other ways. The Version 11 upgrade is a prime example of this. It has created many, many problems for people because some have found that it has wiped out a net registry file that is needed for their computer to run smoothly.
By all means, when you're buying a new version, get the latest and greatest. However, don't feel that you need to obsessively upgrade, just because they've released a new one!
![]()
35) What about if I feel I need one-on-one Metastock training?
There's no doubt about it. Metastock can be a sticking point for Mentorees as they work through the Mentor Program.
Sometimes it can feel a bit overwhelming.
Good News! There's help available.
As well as learning about Metastock by using the videos, the Metastock FAQs, and asking questions in the Metastock topic on the forum - there is another method available.
Some Mentorees prefer the very personal and caring approach of getting some one-on-one tutoring. The training can then be adapted to your specific needs and designed just for you. If that sounds like a good idea, then the information below is essential to read.
|
Jude Fowler Email her for personal |
Past Mentoree - Jude Fowler is happy to train you to use Metastock over the phone - so no matter where you're located, she's just a phone call away. She's fabulous, very caring, and extremely knowledgeable about Metastock, and her very reasonable hourly rate is worth paying for the advantage you'll get. If you're keen on pursuing this, email Jude directly: judy-fowler@outlook.com. Here is what one trader has to say about Jude's training: "As a direct result of the training I’ve received from Jude Fowler I am now confident in my ability to use the main functions of the Metastock software. If you value your time, but don’t have enough of it, Jude’s coaching on Metastock can catapult you to higher levels of usage in a very short time. Her gentle professional approach makes it so easy to learn and apply Metastock skills and techniques, saving many hours of reading manuals and searching the internet for advice." |

So, if you're struggling with Metastock,
you now have a shortcut at your fingertips
Email Jude Fowler today!
judy-fowler@outlook.com.
![]()
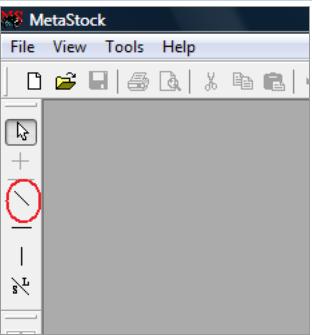
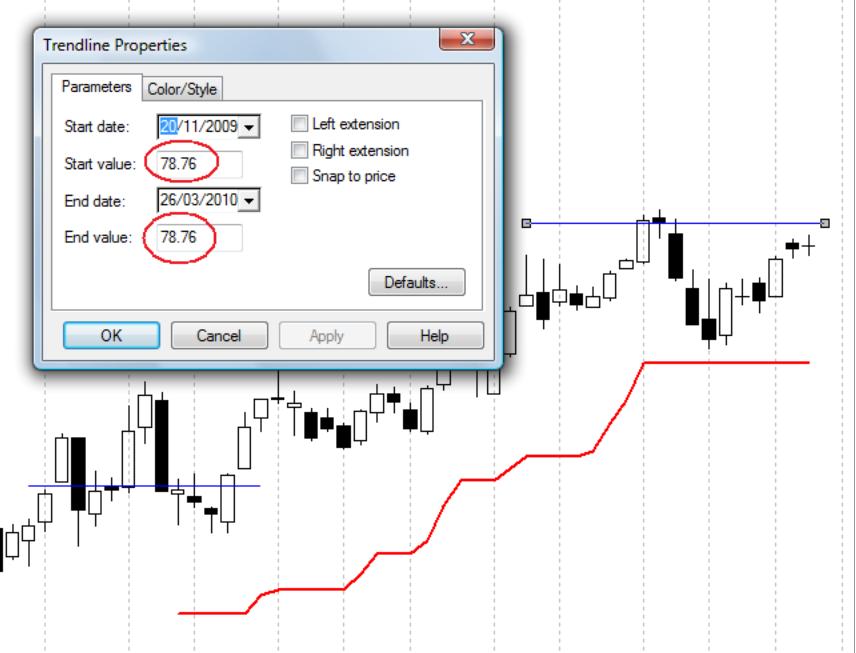
36) How do I draw trendlines at exact prices in Metastock?
This handy hint is contributed by past Mentoree Roy Axelsen:
After many months of using MetaStock, I've only just discovered the following for quick and easy precise placement of horizontal trendlines to show an exact price.
A trendline can be drawn by selecting the trendline tool (in red circle on attached image of left edge of MetaStock screen), and then dragging the mouse to draw the line about where you want it - doesn't even need to be precisely horizontal. After drawing the line, right click it, and select Trendline Properties (see second attached image). If you want to show an entry price, or a pyramid level, simply enter the same price for both the start value and the end value of the line (circled in image), then click OK, and the horizontal trendline snaps to the price you've entered. After this is done, when you hover the cursor over the trendline, a display of the price pops up.
If you want to keep such lines, and you use Smart Charts, you must avoid deleting Smart Charts.
![]()
37) What is the Rad*Chandelier Trailing stop, and can I use a few different modifications?
Our friend and business associate, Richard Dale, has developed the code for an ATR trailing stop, based on the methodology that Chris and Louise are discussing in the Mentor Program. Using this visual representation of the stop will make it easier for you to see when you stop has been hit. It's available to you free of charge.
Scott has put some work into this and developed it even further to make it more flexible, based on your trading requirements.
Attached the zip folders with the stock standard Rad*Chandelier trailing stops and the same trailing stops modified by the following
- Stops hang from the close replacing high and low
- Default year changed to 2010 replacing 2003
- ATR changed to ATR(14) instead of ATR(10)
File 1
Standard Rad Chandelier Stop. Click here and follow the instructions below to load into Metastock.
File 2
Stop hanging from the closing price. Click here and follow the instructions below to load into Metastock.
Importing Instructions
Here are the instructions to import them into Metastock:
Step 1. Save the zip folder to your desktop
Step 2. Read any text files
Step 3. Copy the MS11FORM.DTA file to your desktop
Step 4 Open Metastock
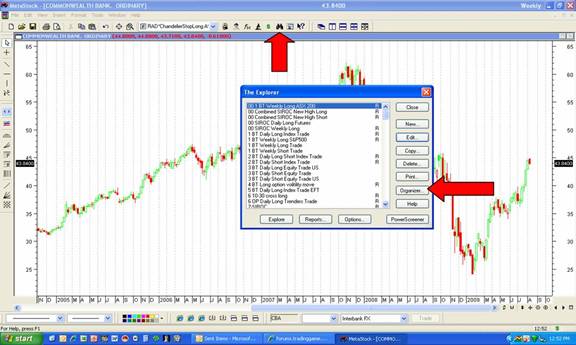
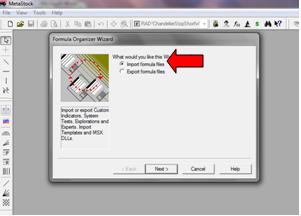
Step 5 Open the Indicator Builder and select the “Organizer” button
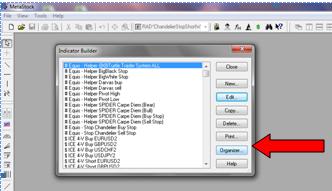
Step 6.
Select Import Files
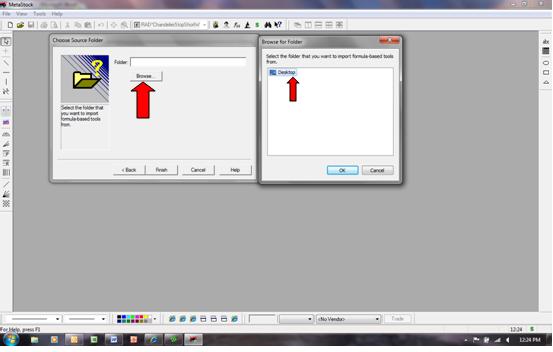
Step 7. Browse and select desktop where the file has been saved
Step 8. Move the zip folders and MS11FORM.DTA file to the recycle bin.
Step 9. Test the trailing stops prior to use.
If you're after the Advanced Stop as a Dll file, click here.
![]()
38) Do you have an Index of all of the lessons and the weeks they appear of Scott's Metastock tutorials?
Well, yes we do!
Here's an Index for you:
Metastock Tutorials Index
Week 3
Lesson 1: Data Setup 5:36 mins
Lesson 2: Opening Charts 4:15 mins
Lesson 3: Updating Your Data & Custom Folders 4:29 mins
Lesson 4: Adding Indicators 8:11 mins
Lesson 5: Drawing Lines 3:28 mins
Week 4
Lesson 6: Adding Text & Symbols 1:04 mins
Lesson 7: Chart Appearance 1:53 mins
Lesson 8: Scrolling Through an Index 2:55 mins
Lesson 9: Indicator Drop-Down List 1:09 mins
Lesson 10: Candlestick Charts 1:45 mins
Week 6
Lesson 11: Default Template 2:56 mins
Lesson 12: Change Default Template 2:42 mins
Lesson 13: Favourites 2:48 mins
Lesson 14: Layouts 2:52 mins
Lesson 15: Buttons 4:06 mins
Week 9
Lesson 16: Indicator Builder 1 2:32 mins
Lesson 17: Indicator Builder 2 2:21 mins
Lesson 18: Trailing Stop 4:17 mins
Lesson 19: Expert Advisor 1 2:35 mins
Lesson 20: Expert Advisor 2 2:12 mins
Week 9 Formula
Lesson 16: Indicator Builder 1 2:32 mins
Name: Volume MA
Formula: Mov(V,30,S)
Lesson 17: Indicator Builder 2 2:21 mins
Name: Volume Close MA
Formula: Mov(V*C,30,S)
Lesson 18: Trailing Stop 4:17 mins
http://www.tradernexus.com/advancedstop/advancedstop.html
Lesson 19: Expert Advisor 1 2:35 mins
Name: Expert in Training
Formula Trend Bull: C>Mov(C,90,S)
Formula Trend Bear: C
Lesson 20: Expert Advisor 2 2:12 mins
Name: Expert in Training
Formula Highlight up: C>O
Formula Highlight Down: C<=O
Week 10
Lesson 21: Expert Advisor 3 3:33 mins
Lesson 22: Explorer 1 5:00 mins
Lesson 23: Explorer 2 2:41 mins
Lesson 24: Explorer 3 3:05 mins
Lesson 1: Data Setup 5:36 mins
Lesson 2: Opening Charts 4:15 mins
Lesson 3: Updating Your Data & Custom Folders 4:29 mins
Lesson 4: Adding Indicators 8:11 mins
Lesson 5: Drawing Lines 3:28 mins
Week 10 - Formula
Lesson 21: Expert Advisor 3 3:33 mins
Name: Expert in Training
Formula symbols Bull: C>Mov(C,90,S) AND Cross(MACD(),0)
Formula symbols Bear: C
Lesson 22: Explorer 1 5:00 mins
Name: Close above MA
Formula Filter Explorer: C>Mov(C,90,S)
Lesson 23: Explorer 2 2:41 mins
Name: Close above MA
Formula Filter Explorer: C>Mov(C,90,S) AND Cross(MACD(),0)
Tab A: C
Tab A Name: Close
Tab B: ATR(14)
Tab B Name: ATR
Lesson 24: Explorer 3 3:05 mins
Name: Close above MACD
Formula Filter Explorer: Cross(MACD(),0)
Timeframe weekly
Date: 23/5/09
Name: Close above MA
Formula Filter Explorer: C>Mov(C,90,S)
Timeframe Daily
Date: 23/5/09